LCARS Online: I gave my data science agents a bridge crew
What if your data science dashboard looked like the bridge of the Enterprise, and actually worked like it too?
What if your data science dashboard looked like the bridge of the Enterprise, and actually worked like it too?
That's the pitch for my All Things Open talk, To Boldly Go: Data Science Exploration with AI Agents (ft Star Trek's LCARS theme), Tuesday, October 20, at 10:30 in Raleigh. The project behind it is LCARS Online. This post is what I built, what broke, and what happened when I let a small local model try to do science.
#A skin that grew a crew
A few years ago I built LCARS-on-Wagtail, a headless Wagtail CMS behind Lou Huang's gorgeous LCARS UI. Super fun! Also just a skin. You couldn't ask it anything.
So I forked it. LCARS Online keeps the look (Vue on the front, Django and Wagtail behind it) and adds a crew of AI agents that analyze real NASA data. All of it runs on my laptop, model included, so conference Wi-Fi can't ruin my morning.
#The mission
The data is NASA's Exoplanet Archive: about 6,400 confirmed planets with their orbits, sizes, masses, and how each one was found. A Prefect flow grabs a fresh copy every morning, and there's a pinned snapshot in the repo for offline demos.
The crew's question: is there a gap in the sizes of small planets?
I picked that one because astronomers already know the answer. It's the radius valley (Fulton et al. 2017). Planets around 1.5 to 2 times the size of Earth are weirdly rare, with rocky super-Earths on one side and puffy sub-Neptunes on the other. If the crew gets it wrong, I'll know.
#The crew
I didn't want one chatbot with a pile of tools. Each station gets one job, a short list of tools it's allowed to use, and a typed output it has to hand back. The agents are PydanticAI (here's why), and every mission is a Prefect flow.
- Ops checks the data and lists the hazards (missing values, inferred masses, that kind of thing).
- Science Officer writes the analysis plan before any results exist, and has to answer every hazard Ops raised.
- Engineering isn't an agent at all. It's plain Python that runs the plan: a smoothed histogram of planet sizes, a statistical test for more than one peak, bootstraps, and a fake dataset with no valley as a sanity check.
- Tactical tries to poke holes in it.
- Captain's Log writes the report as a draft Wagtail page.
- The Captain is me. I approve each step, and the button says Make it so, because obviously.
The big rule: models never compute numbers. Every number comes from one boring, seeded Python file. Approvals, budgets, and the mission log are all enforced in code, so a confused model can't talk its way past a gate.
#What actually broke
I ran the crew on Qwen3.5-9B on my M1 with 16 GB. The first missions failed! Almost every fix after that came from reading a failed mission's log.
My tool lied. The Science Officer kept timing out, once after 16 tool calls on a single plan. Turns out my count_population tool took a broken filter and happily reported 0 planets. So the model assumed it had messed up and burned its whole budget debugging my tool. Now the tool refuses bad filters and says why. If your tool gives a misleading answer, the model will believe it.
Nobody told it the codes. Tactical wanted to check results by discovery method (great instinct!) and filtered on transit and radial_velocity. The archive calls them tran and rv. Zero matches, and the reviewer spent its budget guessing spellings. Now the tool lists the real values.
The reviewer made up numbers. Mission 7's Tactical wrote a pretty good review... and cited p = 0.07 and a "97%" that no tool had ever produced. Now every number in a review has to trace back to something a tool actually produced, or the review gets sent back.
The careful plan that was wrong. Mission 8 is my favorite, because it finished. Ops flagged that some masses were inferred. The Science Officer responded by keeping only planets with measured masses. Sounds responsible! Except the analysis only uses radius. Mass never mattered. The sample dropped from 3,352 planets to 621, the signal faded, and Captain's Log drafted a page titled "No Evidence for a Gap in Small Planet Sizes."
Every step looked careful, nobody computed a bad number, and the conclusion was still wrong. "Not significant with 621 planets" turned into "no evidence." I would've clicked Make it so on that plan. Now hazards can be marked not applicable, filtering on a column the method doesn't use gets bounced, and the report can't turn "not significant" into "no evidence."
#Checking the crew
DeepEval grades finished missions from their logs (did the plan answer every hazard, do the report's numbers match Engineering's), and a bakeoff command scores whatever model is loaded, station by station. DeepTeam red-teams it. There's also a negative control mission where the right answer is "nothing here." If the crew finds a valley in fake data built without one, I don't trust it.
#So what would an astrophysicist say?
Evals check the crew against my rules. They can't tell me if my rules are any good. So I put the analysis through an astrophysicist-style review, then a second one to check the first, because the first one overreached in a couple places. All of these numbers come from rerunning the analysis on the pinned snapshot.
The good news first. Writing the plan before seeing results is something plenty of pros skip. Rerunning across different precision cuts keeps me from cherry-picking. Fixed seeds and a hashed snapshot mean anyone can reproduce a mission. And testing against a known answer is how you calibrate any new instrument.
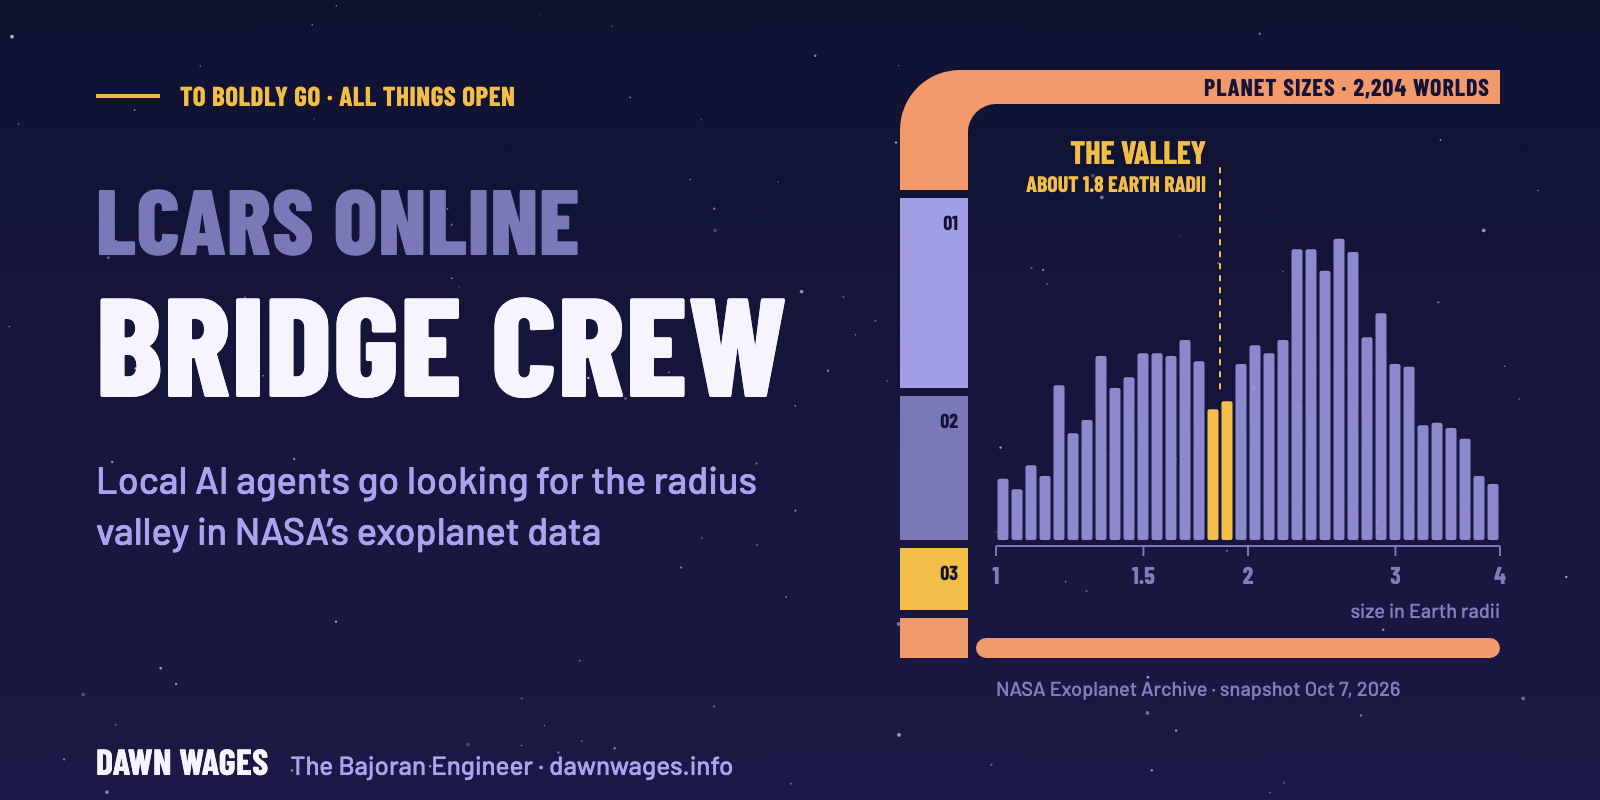
The biggest problem was which planets the crew picked. With every planet thrown in, the dip is weak and shows up only when you barely smooth the data. Then I used the kind of cuts Fulton's team used: transiting planets with measured radius errors, orbits under 100 days, and Sun-like host stars (4,700 to 6,500 K). That leaves 2,204 planets, and the valley shows up near 1.8 Earth radii across reasonable smoothing settings, in all 200 bootstrap resamples at the middle setting, with a 95% interval of 1.74 to 1.88. Not Fulton's figure, but a stable dip in the right place, from public data on a laptop. Picking the population is exactly the Science Officer's job, so that's where the next fixes go.
The rest of the notes, short version:
- Some radii aren't measurements. For 278 planets found by radial velocity, the archive fills in a radius from a mass–radius formula. Those fill the valley in, so filter to transiting planets.
- The smoothing setting matters. Smooth too much and a narrow valley disappears. The plan should pick it based on how precise the radii are.
- Mixing star types blurs things. The valley sits at smaller sizes around cooler stars, and it shifts with orbital period too.
- Depths aren't apples to apples. Fulton corrected for which planets surveys can even detect. I'm counting raw planets, so my valley looks shallower.
- There's no power check. Mission 8's "not significant" could mean no valley, or just too few noisy planets to see one. The fix is injection–recovery: fake a population that has a valley, add real-world noise, run the same pipeline, and see how often it finds it.
- The archive mixes sources. A planet's radius and its star's properties can come from different papers.
- I tuned this knowing the answer. Every fix came after I saw a result I didn't like. That's fine for calibration, but it means I can say the pipeline recovers the valley, not that the crew discovered it. The real test is a question I don't already know the answer to.
So where does that leave it? As a demo of the process, it holds up. As a result, it's better than the crew's own missions made it look. With standard cuts, an agent pipeline on a laptop recovers the radius valley near 1.8 Earth radii from public NASA data. It doesn't measure the valley's depth, and it isn't a discovery. The crew's weakest skill was choosing which planets to study. I'll take it!
#Models
Any .gguf model in ~/models shows up in the bridge's model picker. Qwen3.5-9B is the one I've tested end to end, at about 10 tokens a second. Gemma 4 12B works too. DeepSeek R1 is experimental, since it thinks out loud and blew its budget on the first try. I also benchmarked llama.cpp against MLX: MLX was about 6% faster end to end on my M1. Not enough to switch on this machine, but newer chips favor MLX more.
A full mission takes 15 to 20 minutes on my M1. Slow for a live demo, totally fine for science, so there'll be a recorded run at the talk.
#What I'm taking away
Let the model decide what to check and let code do the math. Small local models are decent at "what should we look at?" and bad at being trusted with numbers.
Read the failed runs. Hardly any of my fixes were about the model being dumb. It was my tools being vague, or a reasonable instinct (be conservative!) going wrong with nothing to catch it.
Validators beat prompts. A prompt that says "only cite real numbers" mostly works. A validator that sends the review back with the numbers it can't find works every time.
Approval gates aren't enough by themselves. Mission 8 got right past me. I wrote recently about why human-in-the-loop isn't enough, and this is a pretty good example.
And none of this is really about exoplanets. Swap in your own dataset and question and keep the crew.
#Try it
The repo goes public at the talk: github.com/dawnwages/lcars-online. On an Apple Silicon Mac, after you clone it:
scripts/setup.sh
scripts/download-models.sh qwen
scripts/start.sh
Then open the bridge at localhost:8080, start a mission, and approve each step as it comes up.
At All Things Open? Come say hi Tuesday morning. Engage!
Star Trek and LCARS are trademarks of CBS Studios / Paramount. This is a fan project, not affiliated with or endorsed by them. LCARS UI by Lou Huang. Data from the NASA Exoplanet Archive, operated by Caltech under contract with NASA.
If this post helped, you can support my open source work on Ko-fi.